mirror of
https://github.com/SqrtMinusOne/dotfiles.git
synced 2025-12-10 19:23:03 +03:00
7 KiB
7 KiB
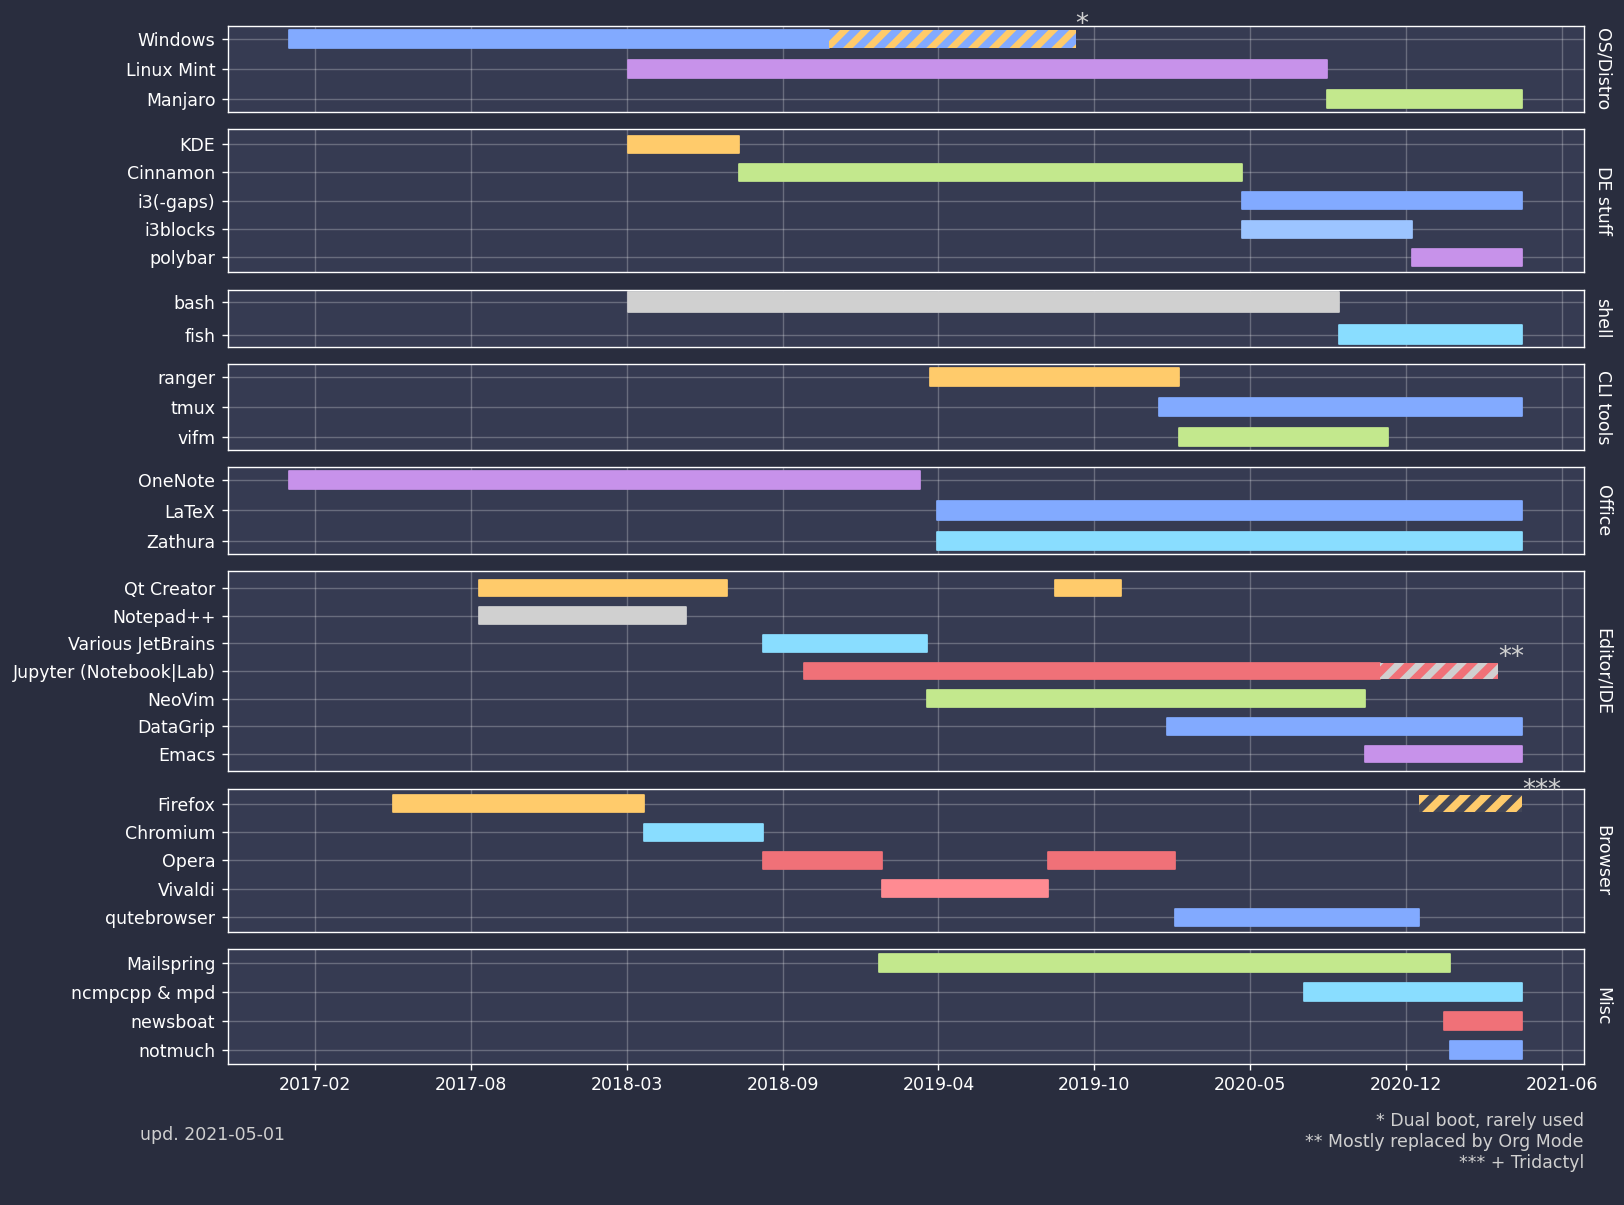
Program Usage History
Init
from matplotlib import pyplot as plt
from matplotlib import dates as mdates
from pprint import pprint
from datetime import date, datetime

import copy
import json
import matplotlib as mpl
import numpy as np
import pandas as pd

mpl.rcParams['figure.dpi'] = 125
mpl.rcParams['figure.facecolor'] = '0.1'
mpl.rcParams['hatch.linewidth'] = 4.0plt.style.use('./palenight.mplstyle')Colors
COLORS = {
    'k': '#292d3e',
    'r': '#f07178',
    'g': '#c3e88d',
    'y': '#ffcb6b',
    'b': '#82aaff',
    'm': '#c792ea',
    'c': '#89ddff',
    'w': '#d0d0d0',
    'k-l': '#434758',
    'r-l': '#ff8b92',
    'g-l': '#ddffa7',
    'y-l': '#ffe585',
    'b-l': '#9cc4ff',
    'm-l': '#e1acff',
    'c-l': '#a3f7ff',
    'w-l': '#ffffff'
}
Load data
Read file
DATA = './history.json'

with open(DATA, 'r') as f:
    data_o = json.load(f)

# pprint(data)
Some preprocessing
def preprocess_data(data):
    data = copy.deepcopy(data)
    for category in data:
        for elem in category['elements']:
            for state in elem['states']:
                if 'TODO' in state['startDate']:
                    print(f'TODO in {elem["name"]} (startDate)')
                    state['startDate'] = state['startDate'].replace('TODO', '').strip()
                state['startDate'] = datetime.strptime(state['startDate'], '%Y-%m-%d')
                try:
                    if 'TODO' in state['endDate']:
                        print(f'TODO in {elem["name"]} (endDate)')
                        state['endDate'] = state['endDate'].replace('TODO', '').strip()
                    state['endDate'] = datetime.strptime(state['endDate'], '%Y-%m-%d')
                except KeyError:
                    state['endDate'] = datetime.today()
                try:
                    state['hatchColor'] = COLORS.get(state['hatchColor'], state['hatchColor'])
                except KeyError:
                    pass
            elem['states'].sort(key=lambda k: k['startDate'])
            try:
                elem['color'] = COLORS.get(elem['color'], elem['color'])
            except KeyError:
                pass
        category['elements'].sort(key=lambda k: k['states'][0]['startDate'])

    return data

data = preprocess_data(data_o)
TODO in Linux Mint (startDate) TODO in Windows (startDate) TODO in Windows (endDate) TODO in bash (startDate) TODO in Mailspring (startDate)
Crop data
def crop_data(data, start_date):
    data = copy.deepcopy(data)
    for category in data:
        for elem in category['elements']:
            elem['states'] = [
                state for state in elem['states']
                if state['endDate'] >= start_date
            ]
            for state in elem['states']:
                if state['startDate'] <= start_date:
                    state['startDate'] = start_date

        category['elements'] = [
            element for element in category['elements']
            if len(element['states']) > 0
        ]

    data = [
        category for category in data
        if len(category['elements']) > 0
    ]
    return data

data = crop_data(data, datetime(2017, 1, 1))
Plot one category
CAT_W = 0.3

def process_category(category, ax, is_last=True, notes=None):
    ticks = list(range(0, -len(category['elements']), -1))
    if notes is None:
        notes = []
    min_start_date = 10**9
    for elem, k in zip(category['elements'], ticks):
        for state in elem['states']:
            start_date, end_date = mdates.date2num(state['startDate']), mdates.date2num(state['endDate'])
            min_start_date = min(min_start_date, start_date)
            kwargs = {}
            kwargs['color'] = elem.get('color', None)

            if state.get('state', None) == 'dashed':
                kwargs['hatch'] = '//'
                kwargs['edgecolor'] = state.get('hatchColor', 'y')
                kwargs['lw'] = 0

                note = state.get('note', None)
                if note is not None:
                    notes.append(note)
                    stars = '*' * len(notes)
                    ax.text(end_date, k + CAT_W * 0.7, stars, size=15)

            bars = ax.broken_barh(
                [(start_date, end_date - start_date)],
                (k - CAT_W, CAT_W * 2),
                ,**kwargs
            )

    ax.set_yticks(ticks)
    ax.set_yticklabels([elem['name'] for elem in category['elements']])
    ax.set_axisbelow(True)
    ax.grid(True, alpha=0.25)
    if not is_last:
        ax.tick_params(axis='x', which='both', labelbottom=False, length=0)
    else:
        ax.xaxis.set_major_formatter(mdates.DateFormatter('%Y-%m'))

    return notes

def plot_notes(fig, ax, notes, x=0.9, y = 0.03):
    if len(notes) > 0:
        notes_text = ''
        for i, note in enumerate(notes):
            notes_text += '*' * (i + 1) + ' ' + note + '\n'
        ax.text(x, y, notes_text, transform=fig.transFigure, va='top', ha='right')

fig, ax = plt.subplots(figsize=(12, 3))
notes = process_category(data[0], ax)
ax.set_title(data[0]['title'])
plot_notes(fig, ax, notes)
notes| Dual boot, rarely used |

Plot all separately
def plot_category(category):
    fig, ax = plt.subplots(figsize=(12, len(category['elements']) * 0.7 + 1))
    notes = process_category(category, ax)
    ax.set_title(category['title'])
    plot_notes(fig, ax, notes)
    return fig

def plot_separate(data):
    for category in data:
        fig = plot_category(category)
        # fig.tight_layout()
        fig.savefig(f'./img/{category["title"].replace("/", "-")}.png')

# plot_separate(data)
Plot all in one chart
def plot_all(data):
    fig, axes = plt.subplots(
        len(data),
        gridspec_kw={
            'height_ratios': [len(datum['elements']) for datum in data]
        },
        figsize=(14, 11),
        sharex=True
    )
    notes = []
    for i, [datum, ax] in enumerate(zip(data, axes)):
        is_last = i == len(data) - 1
        notes = process_category(datum, ax, is_last=is_last, notes=notes)
        ax.yaxis.set_label_position("right")
        ax.set_ylabel(datum['title'], labelpad=16, rotation=270)
    plot_notes(fig, ax, notes, y=0.09)
    # fig.tight_layout()
    fig.subplots_adjust(hspace=0.15)
    ax.text(0.075, 0.08, f'upd. {datetime.now().strftime("%Y-%m-%d")}', transform=fig.transFigure, va='top', ha='left')

plot_all(data)